
What is Volume Profile?
Volume Profile is a technical analysis indicator used by traders to analyze the volume traded at each price level over a specified period of time. It provides a visual representation of the volume traded at each price level, allowing traders to identify areas of support and resistance and potential price levels where buying or selling pressure may be concentrated.
The Volume Profile indicator is displayed as a histogram on the price chart, with each bar representing the volume traded at a specific price level. The width of the histogram bars is proportional to the amount of volume traded at that price level. The highest volume bars are typically shaded or highlighted, making them easier to identify on the chart.
Traders can use the Volume Profile indicator in a number of ways. For example, they can use it to identify areas of support and resistance based on the highest volume bars, which may represent areas where buyers or sellers are more active. They can also use it to identify potential entry and exit points based on changes in volume and price action.
The Volume Profile indicator can be used in conjunction with other technical indicators and analysis tools to make informed trading decisions. It can be particularly useful for traders who use price action or support and resistance levels in their trading strategies. However, like all technical indicators, it should be used in conjunction with other tools and analysis to make informed trading decisions. It is important to note that no indicator can predict future price movements with complete accuracy, and traders should always manage their risk and use proper money management techniques when trading.
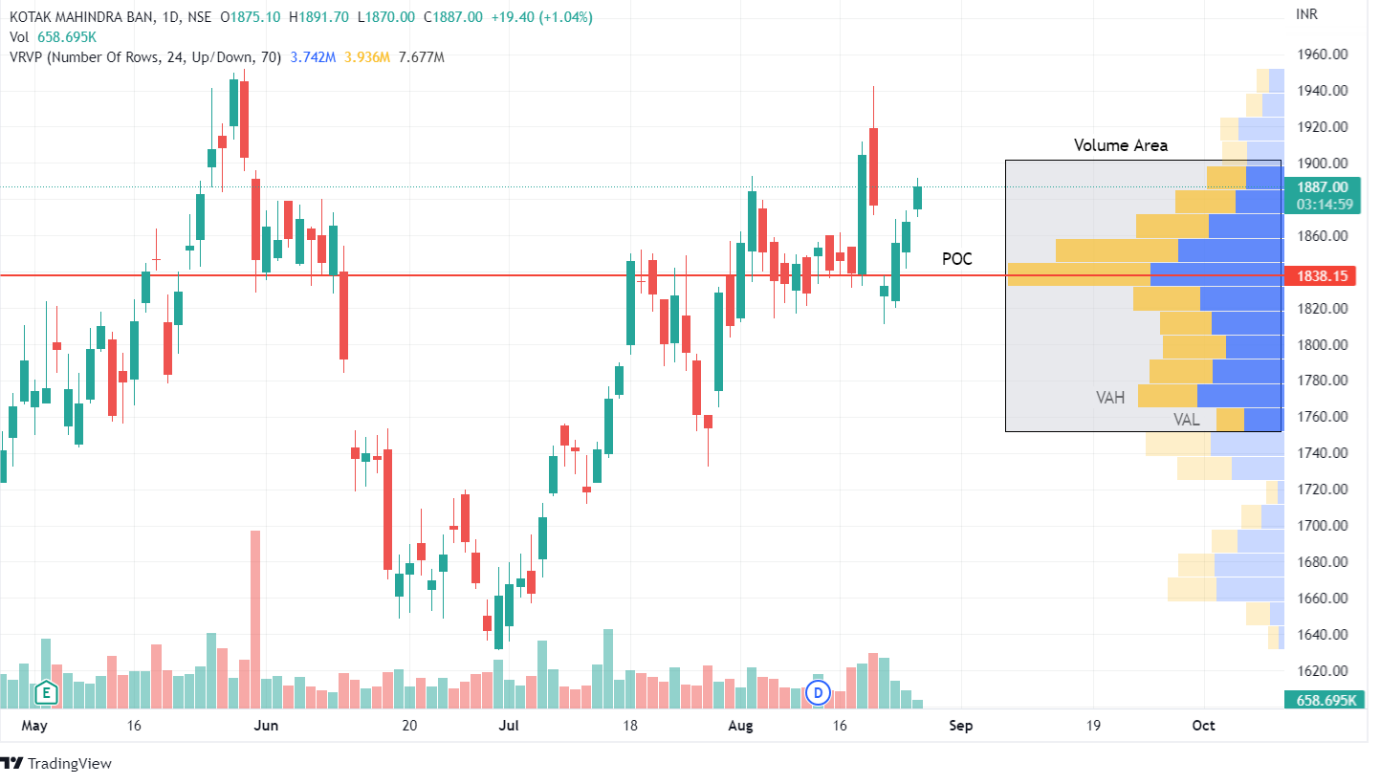
- The Value Area (VA) is the price range in which 70% of the total volume was traded, and it is frequently coloured differently for easier visualisation.
- Value Area High (VAH) – This is the highest price in the 70% total value area.
- Low-Value Area (VAL) – the lowest price in the 70% total value area.
- The Point of Control (POC) is the single price level where the most volume was traded for the session and represents the area with the most open trading positions.
After understanding the terms used in this volume indicator, let us know how to trade with Volume Profile:
How to trade with Volume Profile?
are the ways you can trade with volume profile indicator:Below
1. Support and Resistance
Most traders will first use a volume profile to identify basic support and resistance levels. However, we should note that using the Volume Profile as a support and resistance level identifier is reactive.
This means that the method of volume profile indicator is different from proactive methods like moving averages that are based on recent price action and are used to predict future price movements.
Reactive methods can help assign meaning or significance to price levels that the market has already passed through. According to basic technical analysis, a support level is a level that will prevent a price from falling, and a resistance level is a price level that can stop a price on its way up.
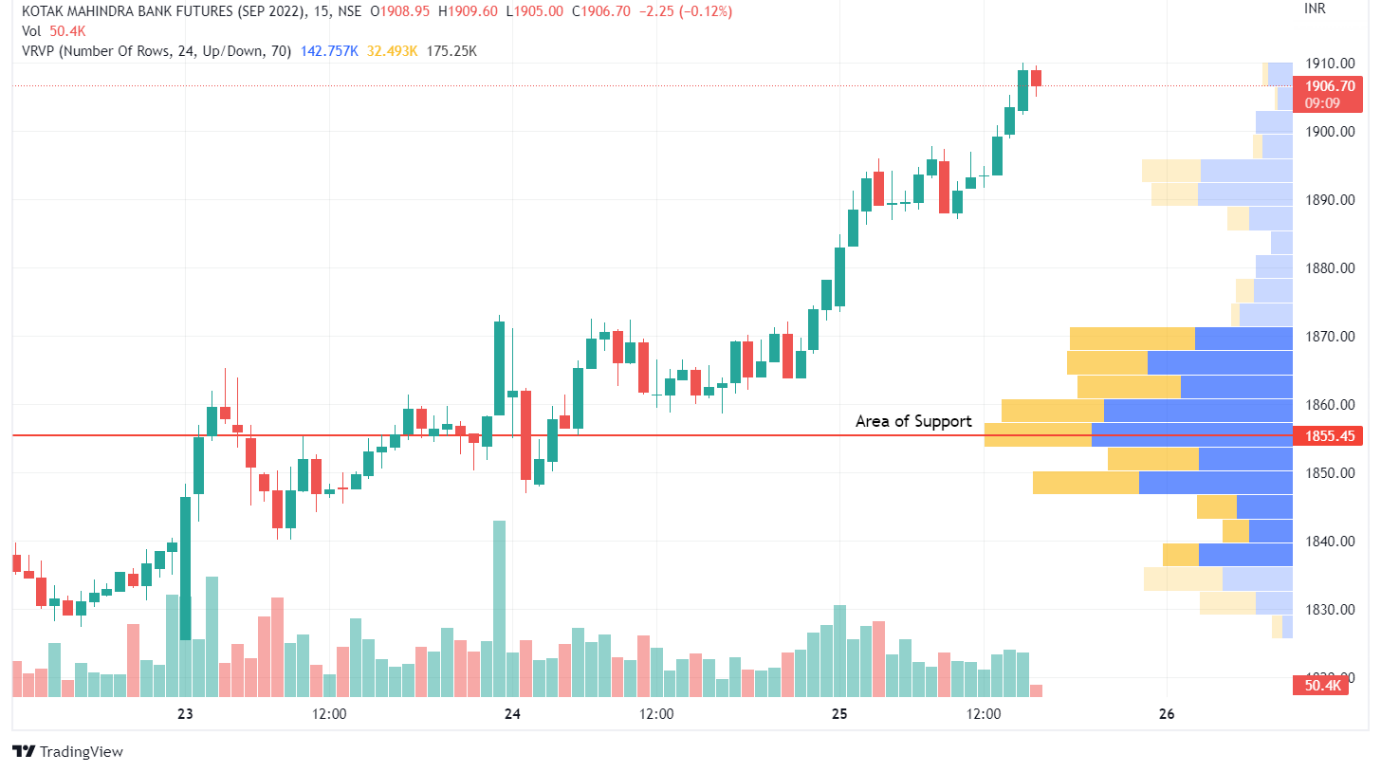
As a result, a price level near the bottom of the profile favouring the buy side in terms of volume is a good indicator of a support level. The inverse is also true. A price level that is near the top of this indicator that favours the selling side volume strongly indicates a resistance level.
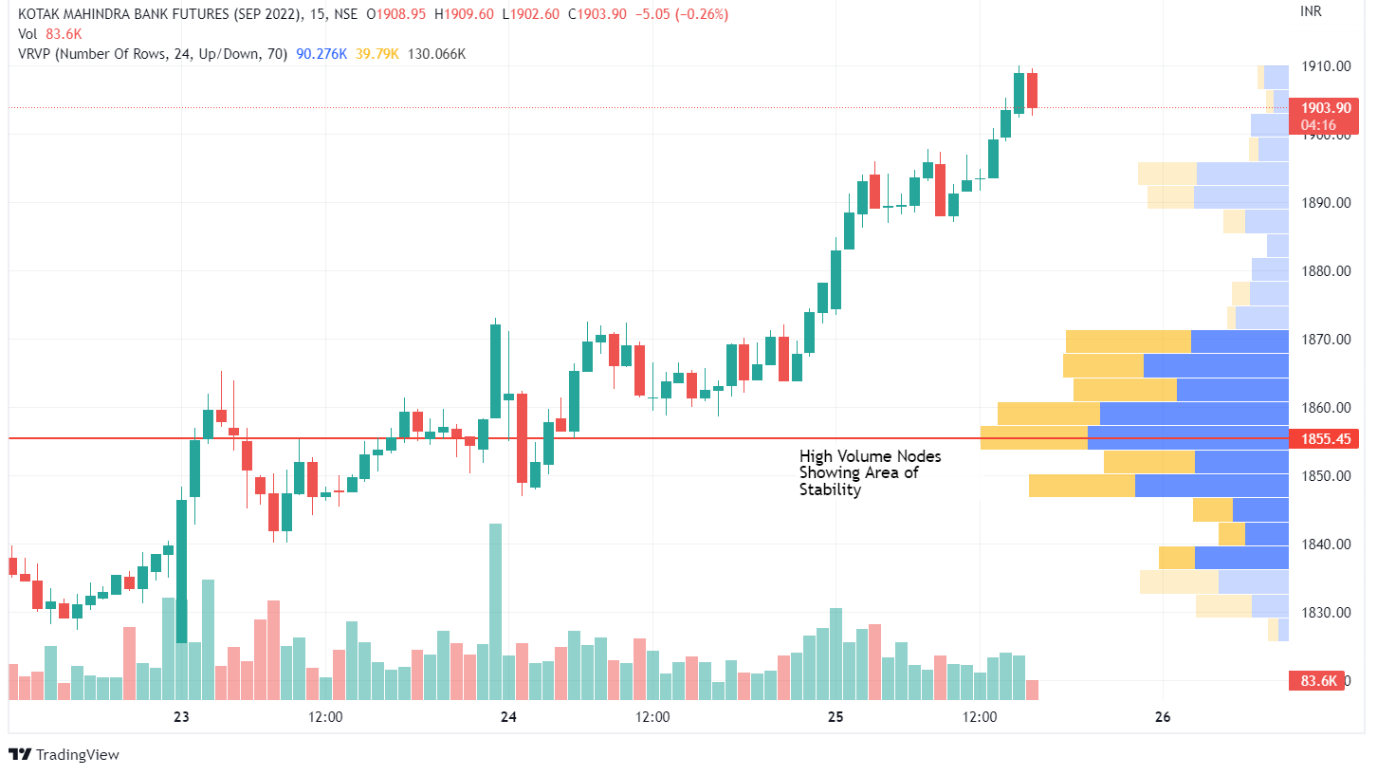
2. High Volume Nodes and Low Volume Nodes
High Volume Nodes (HVN) are volume peaks at or near a price level. HVN can be interpreted as a sign of a period of consolidation. When compared to other levels in the profile, there is usually a lot of activity on both sides, and the market stays at that price level for a long time.
This could indicate a “fair value area” for the asset. A range-bound market is expected when the price approaches a previous HVN (or fair value area).
Low Volume Nodes (LVN) are volume valleys (or significant drops) at or near a price level. Low Volume Nodes are typically caused by a breakout rally or a breakdown. During a rally or a breakdown, there is usually a burst of volume followed by a significant drop-off.
Fixed Range Volume Profile
Fixed Range Volume Profile is a type of Volume Profile indicator that is used to analyze the volume traded within a fixed price range over a specified period of time. This type of Volume Profile is useful for traders who want to focus on a specific price range and analyze the volume traded within that range.
The Fixed Range Volume Profile indicator displays a histogram on the price chart, with each bar representing the volume traded within the fixed price range. The width of the histogram bars is proportional to the amount of volume traded within that range. The highest volume bars are typically shaded or highlighted, making them easier to identify on the chart.
Traders can use the Fixed Range Volume Profile indicator to identify areas of support and resistance within the fixed price range. They can also use it to identify potential entry and exit points based on changes in volume and price action within the fixed price range
Session Volume Profile
Session Volume Profile is a type of Volume Profile indicator that is used to analyze the volume traded during a specific trading session. This type of Volume Profile is useful for traders who want to focus on the volume traded during a specific period of time, such as the opening or closing session of the market.
The Session Volume Profile indicator displays a histogram on the price chart, with each bar representing the volume traded during the specified trading session. The width of the histogram bars is proportional to the amount of volume traded during that session. The highest volume bars are typically shaded or highlighted, making them easier to identify on the chart.
Traders can use the Session Volume Profile indicator to identify areas of support and resistance within the specified trading session. They can also use it to identify potential entry and exit points based on changes in volume and price action within the session


1 thought on “Session Volume Profile”
Adds New dimension to the Trading Technique.
Thanks LeeGa!